Home > Dashboard > Connection Dashboard
Download this articleConnection Dashboard
On the Connection overview dashboard, you can monitor the connection creation, modification, as well as usage in each tenant and container with the following cards and charts.
Total Connections

The Total connections card shows the current total number of connections and the difference with the data of the last month.
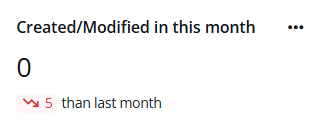
Created/Modified in This Month

The Created/Modified in this month card shows the number of connections created or modified in this month and the difference with the data of the last month.
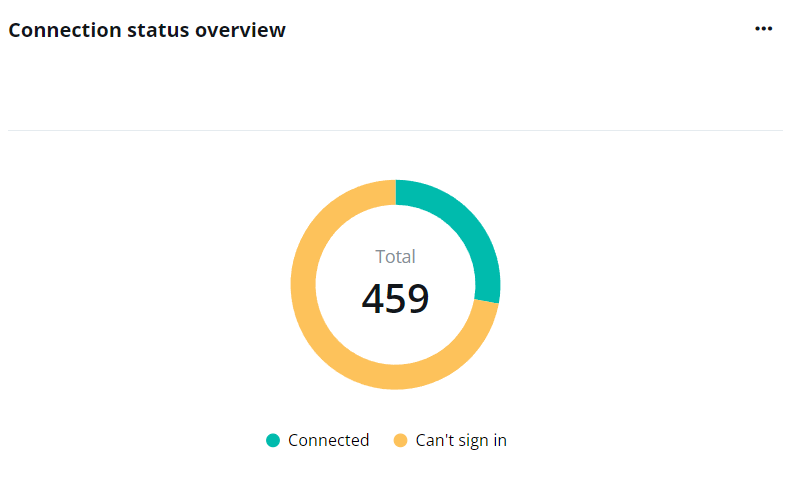
Connection Status Overview

The Connection status overview chart shows the total number of connections and the proportions of connections in the Connected as well as Can’t sign in statuses.
Hover your mouse over the ring to see the detailed number of connections in each status.
To view the list of connections in the Can’t sign in status and their details, click the action list icon (...) in the upper-right corner of the chart and click View connections that can’t sign in.
Top Connectors Used

The Top connectors used chart ranks the connectors by the number of connections created. The X-axis is the number of connections, and the Y-axis is the connectors.
Hover your mouse over a bar to view the detailed number of connections created under the connector.
Top connection makers

The Top connection makers chart ranks the users by the number of connections they have created. The X-axis is the number of connections and the Y-axis is the users.
Hover your mouse over a bar to view the detailed number of connections created.
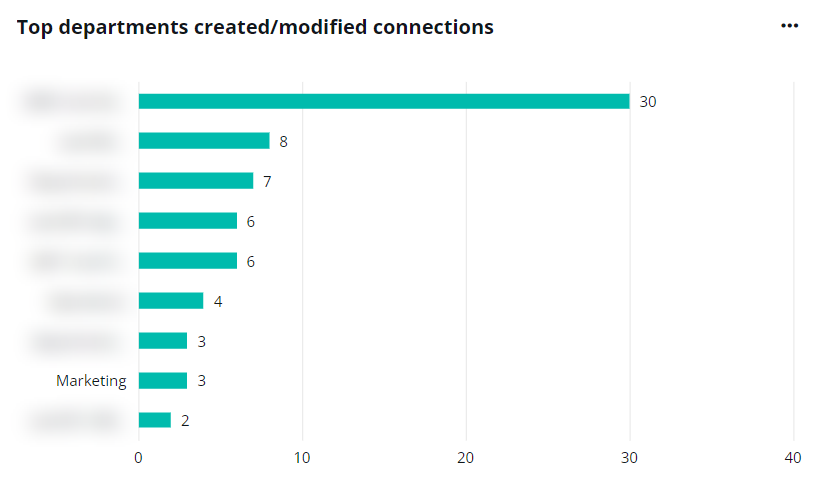
Top departments created/modified connections

The Top departments created/modified connections chart ranks the departments in which users have created/modified connections by the connection numbers. The X-axis is the connection numbers, and the Y-axis is the departments.
Hover your mouse over a bar to view the detailed number of connections created in the department.
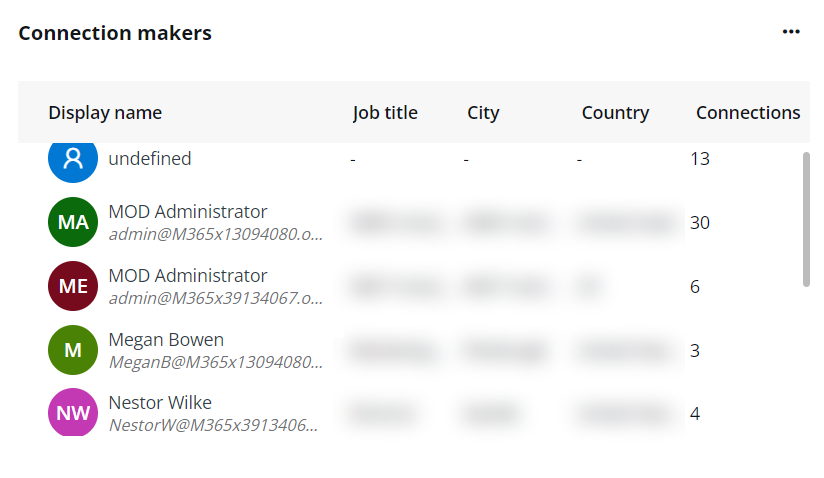
Connection makers

The Connection makers table shows the top connections makers’ details, including their job titles, cities, countries, and numbers of connections made. Up to top 10 users are included in this table.