Home > Workspace Management > View Overview Statistics of a Tenant
Download this articleView Overview Statistics of a Tenant
When you click a tenant name on the Workspace management page, you switch to the tenant level.
You’ll be brought to the Overview page where you can view the tenant overview statistics from five perspectives: Workspace overview, Data security posture management, Copilot analysis, Data protection, and Discovery & optimization.
Some statistics are based on the audit log search results. To view completed statistics, make sure that you have turned on auditing in the Microsoft Purview portal.
It may take several hours after you turn on the audit log search before you can return the audit log search results. For more information, refer to Turn on audit log search.
Click Export as PDF in each tab allows you to export the statistics under the tab to a PDF file. Refer to the sections below for details about each tab.
This action is not available for the users who only have View only permission to Workspace management.
Workspace Overview
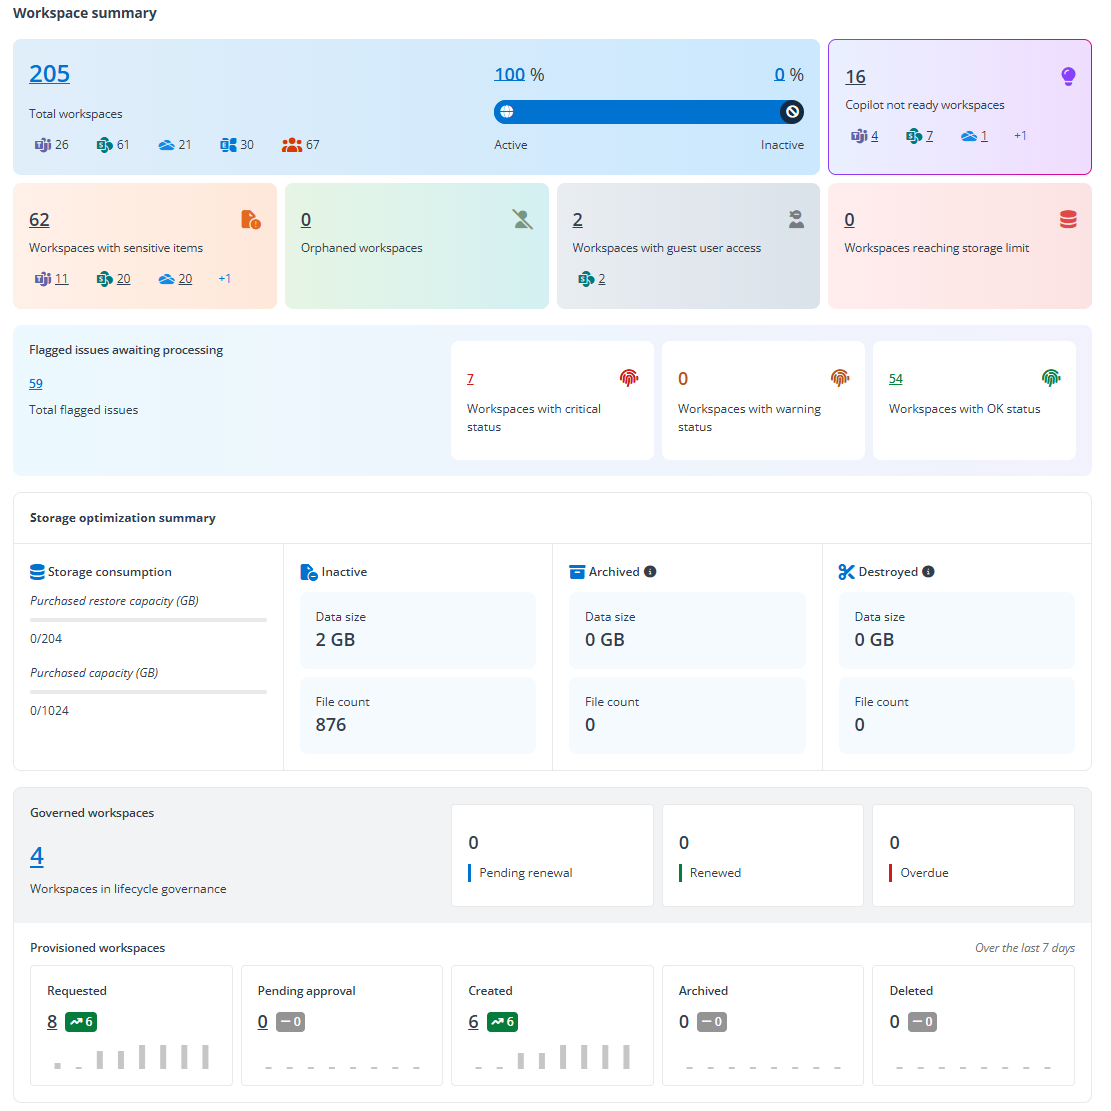
In the Workspace overview tab, there are four sections: Workspace summary, Storage optimization summary, Governed workspaces, and Provisioned workspaces.
-
In the Workspace summary section, the following statistics are displayed in each tile. For detailed information about workspaces, refer to View Workspaces of a Tenant.
-
The total number of workspaces in the tenant, the number of workspaces for each data source, and the ratio of active and inactive workspaces. The total number of workspaces, the ratio of active workspaces, and the ratio of inactive workspaces are clickable, and you’ll be brought to the Workspaces page with the corresponding workspaces listed.
-
The total number of workspaces that are not ready for Copilot and the number of Copilot not ready workspaces per data source. Click the tile to access the Workspaces page where the corresponding workspaces are listed in the table.
-
The total number of workspaces where there are sensitive items, and the number of workspaces with sensitive items per data source. Click the tile to access the Workspaces page where the corresponding workspaces are listed in the table.
-
The total number of workspaces for which there are no available owners, and the number of orphaned workspaces per data source. Click the tile to access the Workspaces page where the corresponding workspaces are listed in the table.
-
The total number of workspaces with guest user access, and the number of such workspaces per data source. Click the tile to access the Workspaces page where the corresponding workspaces are listed in the table.
-
The total number of workspaces that are reaching storage limit, and the number of such workspaces per data source. Click the tile to access the Workspaces page where the corresponding workspaces are listed in the table.
-
The total number of flagged issues that are awaiting processing within the tenant and the numbers of workspaces with the critical, warning, and OK workspace status. Click the number link to access the Workspaces page with SharePoint sites that have flagged issues or with the corresponding workspace status listed in the table.
NOTEThis section only appears for the tenants of which the customer has the on-demand feature enabled.
-
-
In the Storage optimization summary section, you can view the storage consumption, inactive data size and file count, archived data size and file count, and destroyed data size and file count within the tenant.
-
In the Governed workspaces section, you can view the total number of workspaces that have a lifecycle policy applied. In the three tiles to the right, you can view the number of workspaces that are pending renewal, the number of workspaces that are renewed, and the number of workspaces of which renewal tasks are overdue. These three numbers are clickable, and you’ll be brought to the Workspaces page where the corresponding workspaces are listed in the table.
-
In the Provisioned workspaces section, you can view the numbers of workspaces that are requested, pending approval, created, archived, and deleted separately in each title, as well as the trend of each statistic over the last 7 days.
Data Security Posture Management
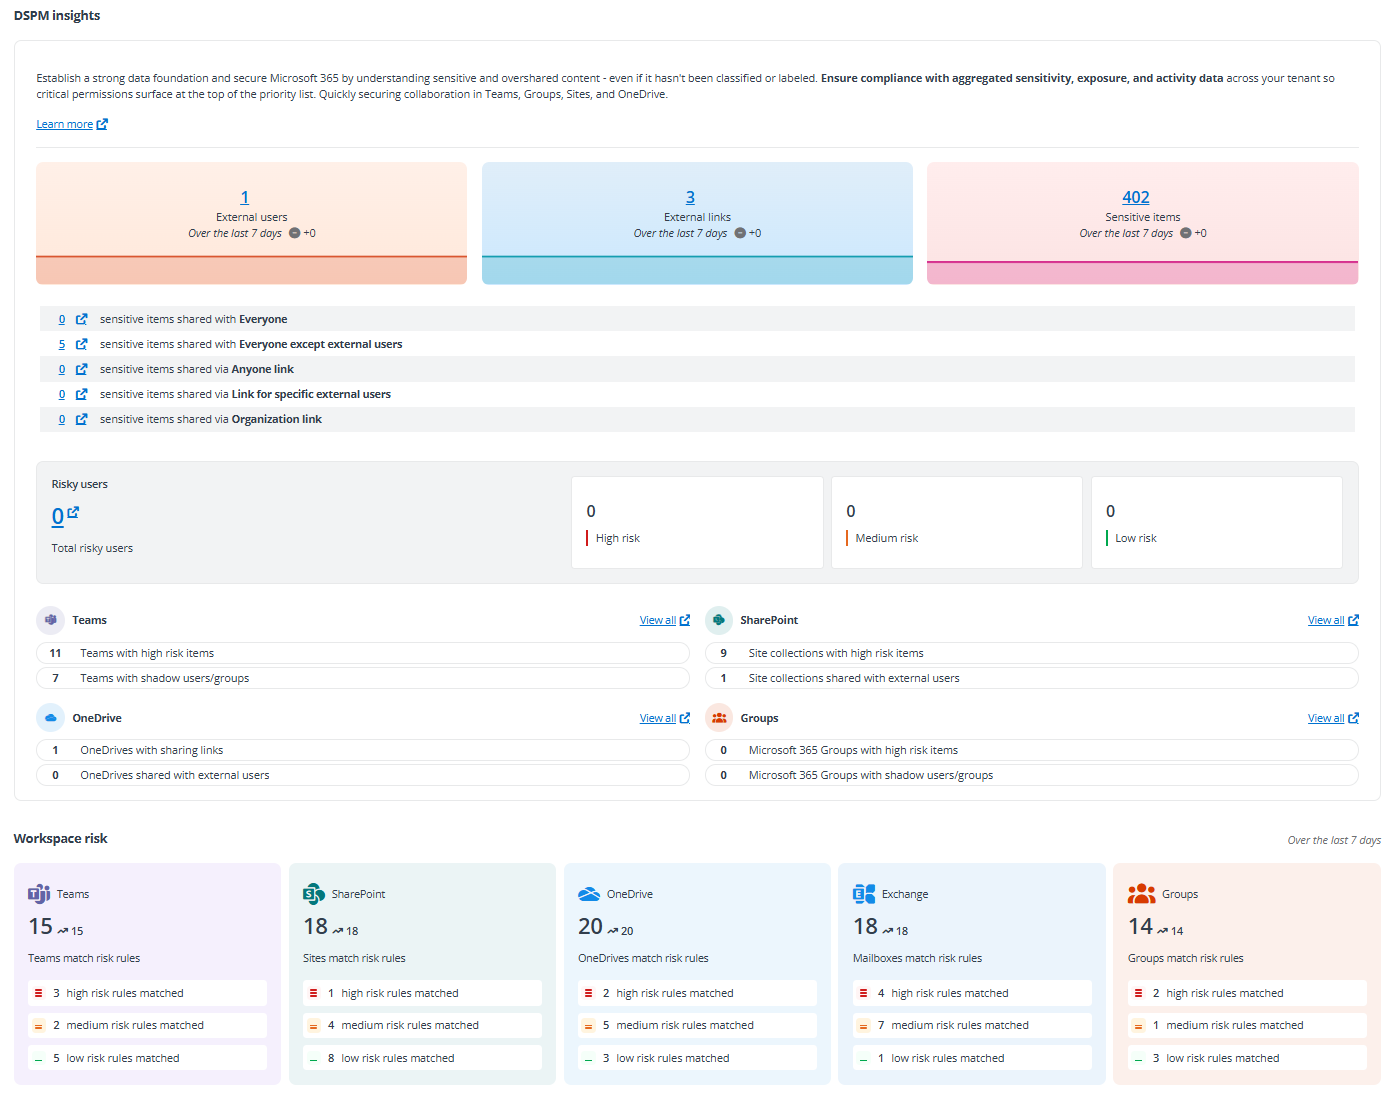
Under the Data security posture management tab, there are four sections: DSPM insights, Risky users, data source analysis, and DSPM risks.
-
In the DSPM insights section, you can view three statistics in tiles, including the number of external users, external links, and sensitive items in the tenant. Below the tiles, you can view the numbers of sensitive items that have been shared with the Everyone and Everyone except external users groups. In the meanwhile, you can view the numbers of sensitive items that have been shared via the following links:
-
Anyone link – Anyone who receives the link can access the shared item, including people outside the organization.
-
Links for specific external users – The item is shared via link with specific people and there are external users in the sharing scope.
-
Organization link – The item is shared via link with anyone in the organization who has the link.
-
-
In this section, click any number link and you’ll be redirected to Insights. Click Continue visit to access the corresponding Insights page. For more information, refer to Insights User Guide.
-
In the Risky users section, you can view the total number of risky users, and clicking this link allows you to go to Insights Risky users page. In the tiles to the right, you can view the numbers of risky users with High, Medium, and Low risks separately.
-
In the data sources section, you can view the statistics of each data source.
-
Teams – The number of Teams that have high risk items and the number of Teams where shadow users or groups exist are listed.
-
SharePoint – The number of site collections that have high risk items and the number of site collections that are shared with guest users.
-
OneDrive – The number of OneDrives where objects are shared via links and the number of OneDrives that are shared with external users are listed.
-
Groups – The number of Microsoft 365 Groups that have high risk items and the number of Microsoft 365 Groups where shadow users or groups exist are listed.
Click View all in the upper-right corner of a data source to access the Risk analysis > Overview page of the corresponding data source.
-
-
In the Workspace risk section, you can view the total number of workspaces that match risk rules per data source, and clicking the number link allows you to access the Risk management > Risk detection page with all workspaces that match risk rules of the corresponding data source displayed. In addition, the trend of workspaces per data source over the last 7 days can be viewed. In each data source tile, you can also view the numbers of workspaces in each source that match the high, medium, and low risk rules separately.
Copilot Analysis
In the Copilot analysis tab, there are three sections: Security information, Data readiness, and Adoption overview.
-
In the Security information section, you can view two types of statistics, OneDrive and the other workspaces. You can view the number of workspaces where sensitive items are shared via links, the number of workspaces where sensitive items are shared with the Everyone group, and the number of workspaces where objects are shared with external users. In addition, the trend of each statistic over the last 7 days is displayed below each statistic.
-
In the Data readiness section, the number of workspaces that are ready for Copilot, the number of inactive workspaces, the number of orphaned workspaces, and the number of workspaces where highly confidential files exist are displayed in tiles separately. Click a number link to access the Workspaces page with the corresponding workspaces listed in the table. For more information, refer to View Workspaces of a Tenant. The trend over the last 7 days is also displayed below each number link.

-
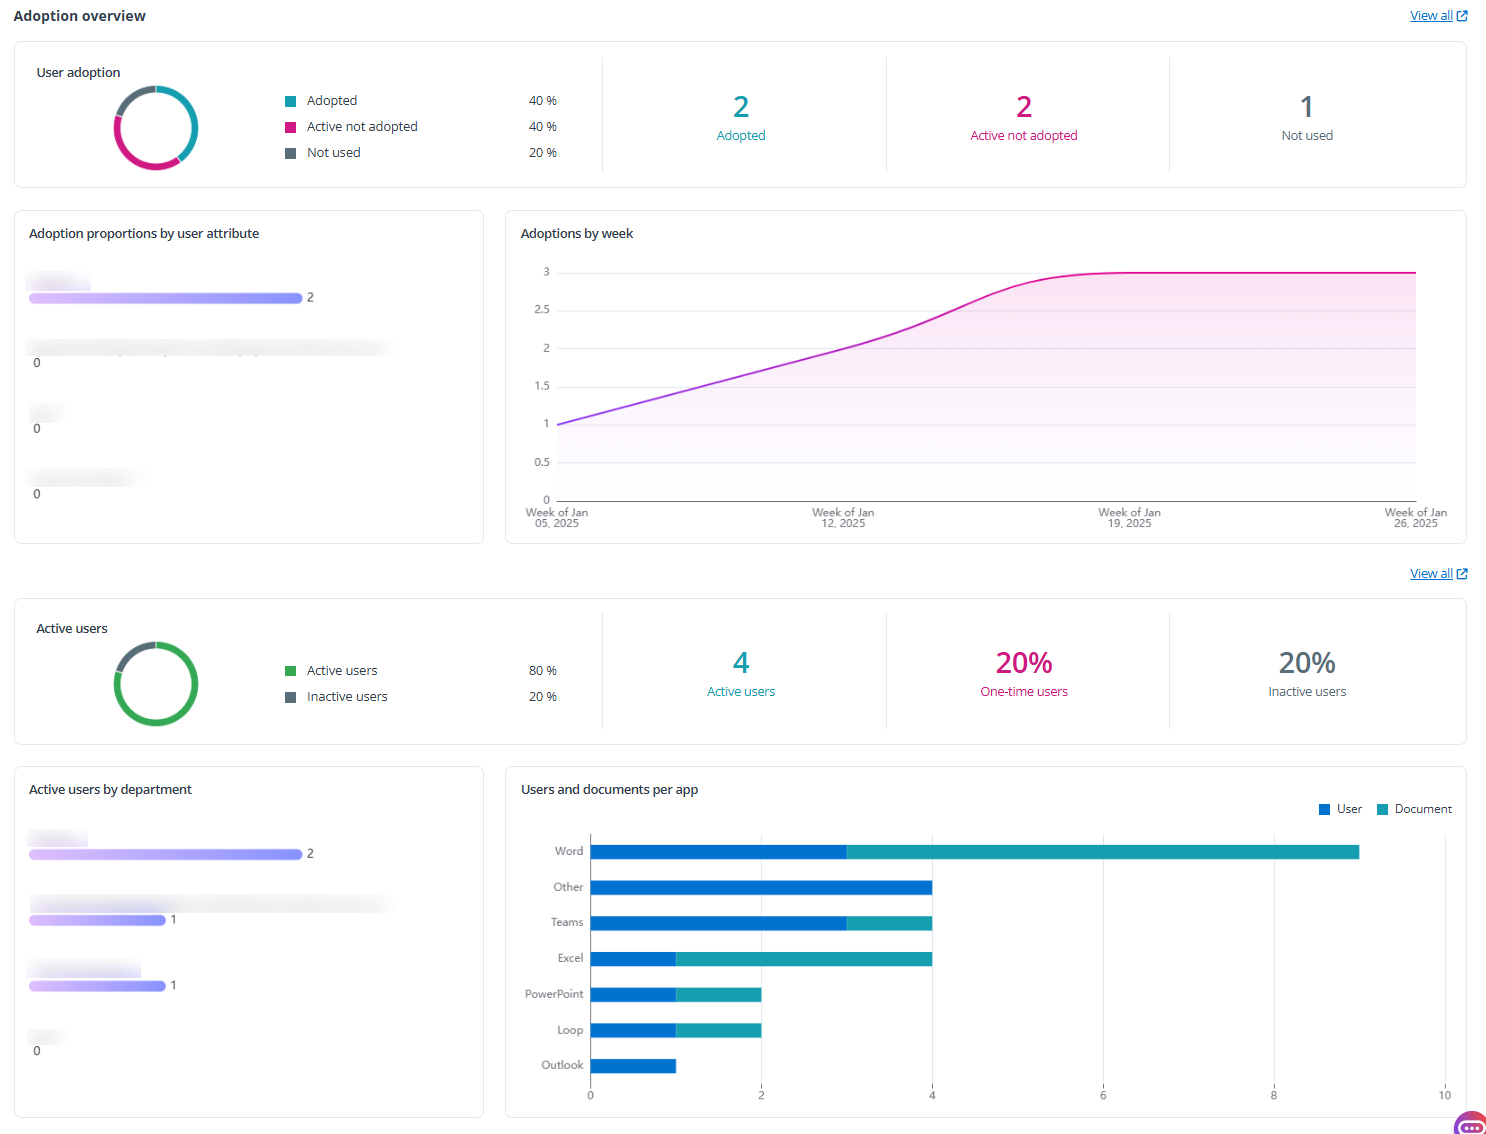
The Adoption overview section provides insights into how users engage with Copilot. It tracks adoption metrics, usage patterns, and the integration of Copilot features across various M365 applications. This helps organizations understand user engagement levels and the effectiveness of Copilot in enhancing productivity within their digital environment. Click View all to view the Adoption overview report in tyGraph. For more information, refer to tyGraph User Guide.
-
User adoption – The doughnut chart indicates the percentage of adopted users, active but not adopted users, and users who have not used Copilot during the selected period. The number of each type of users can be viewed in the tiles to the right.
-
Adopted – Adopted users are highly engaged individuals who consistently, frequently, and broadly use Microsoft 365 Copilot. A user is considered adopted if they use Copilot more than one day per week, at least three times per week, and in at least one Microsoft 365 app per week.
-
Active not adopted – Number of users who have interacted with Copilot but fall short of the adoption thresholds. While they show some level of engagement, they are not yet considered fully adopted based on consistency, frequency, and breadth of use.
-
Not used – Number of licensed users who have not used Copilot at all during the selected reporting period. Monitoring this number helps identify missed opportunities for enablement or license reassignment.
-
-
Adoption proportions by user attribute – The bar chart displays various metrics based on different user attributes. Each attribute offers a unique perspective on Copilot usage across the organization.
-
Adoptions by week – The total unique users with activity over time displayed in line graph form.
-
Active users – Active users are those who have engaged with Copilot at least once during the past 30 days. One-time users are those who have used Copilot only once since receiving a license. This visual illustrates the percentage of all licensed Copilot users who have had at least one interaction with Copilot during the past 30 days, as well as the percentage of users who have not interacted with Copilot during the same period.
-
Active users by department – This bar chart shows the adoption proportion of users based on user department.
-
Users and documents per app – This visual displays the number of unique users and documents per app, indicating which productivity app users spend the most time in while using Copilot.
-
Data Protection
The Data protection tab includes three sections: Data insights, Workspace risk, and Data security.
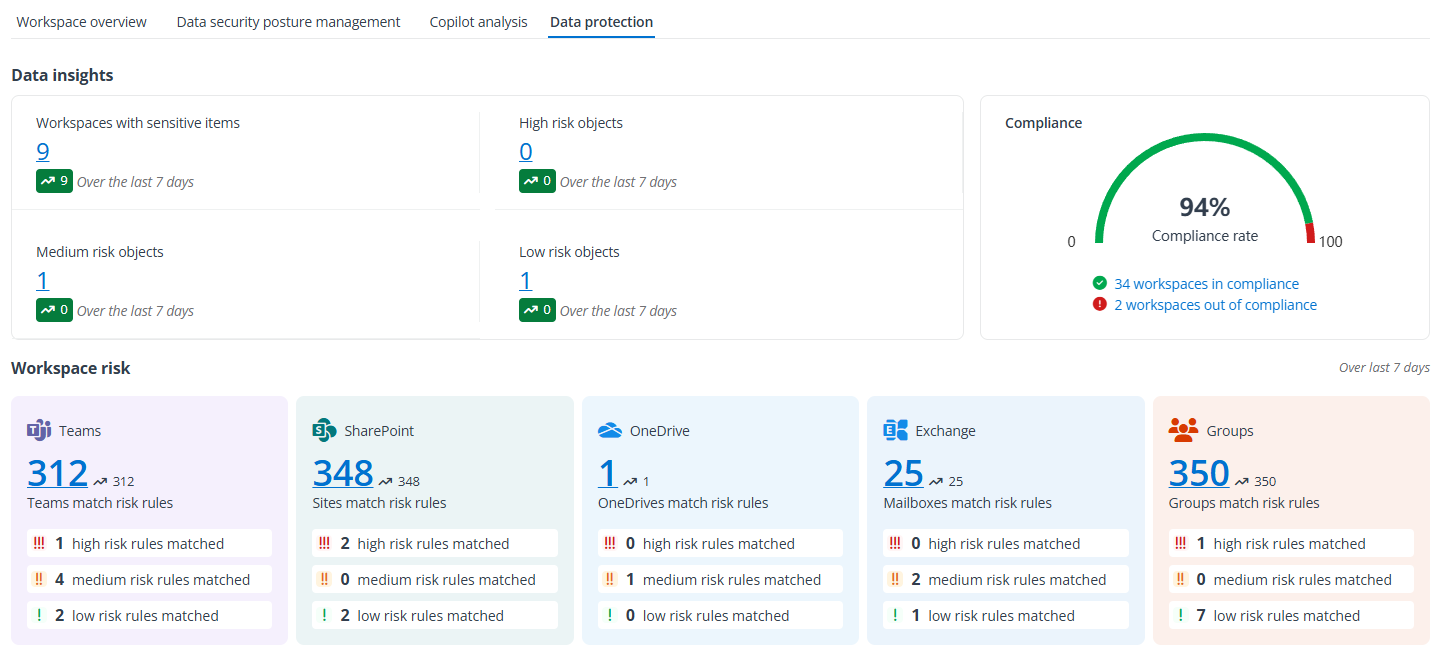
Data insights and Workspace risk sections.
Data security section.
-
In the Data insights section, you can view the following:
-
The number of workspaces where there are sensitive items, and the number of high, medium, and low risk objects in the tenant. In addition, the trend of each statistic over the last 7 days can also be viewed.
-
The numbers of workspaces that are in compliance and those out of compliance. In the chart, you can view the compliance rate. Click a number link to view the corresponding workspaces on the Workspaces page.
-
-
In the Workspace risk section, you can view the total number of workspaces that match risk rules per data source, and clicking the number link allows you to access the Risk management > Risk detection page with all workspaces that match risk rules of the corresponding data source displayed. In addition, the trend of workspaces per data source over the last 7 days can be viewed to the right. In each data source tile, you can also view the numbers of workspaces in each source that match the high, medium, and low risk rules separately.
-
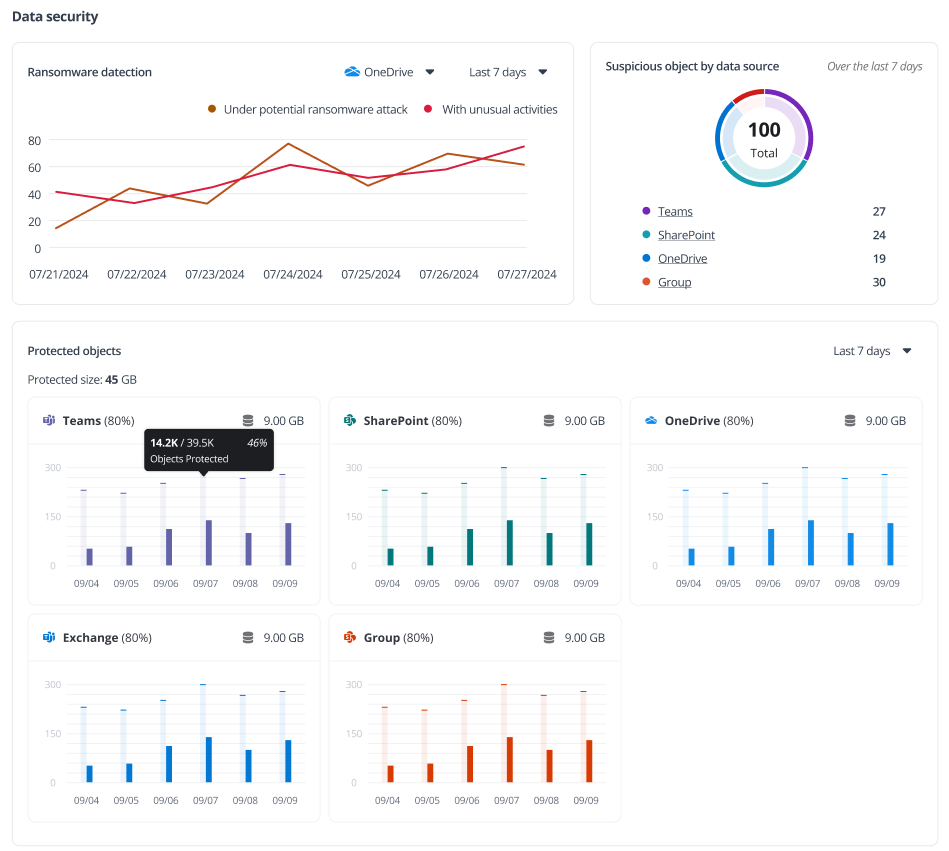
The Data security section, you can view the tenant data protected by Cloud Backup. If the production subscription of the customer has expired or the customer does not have the corresponding production subscription, only the sample data will be displayed here.
-
Ransomware detection – This chart shows the data tracked over the last 7/30 days for unusual activities and potential ransomware attacks. You can select the data source for which the ransomware detection data you want to view.
-
Suspicious objects by data source – This pie chart shows the percentage of suspicious objects of each data source over the last 7 days.
-
Protected objects – The statistics of each data source are displayed in the corresponding tile. You can view the percentage of the backed up object. The bar chart below shows the trend of the total objects detected in the tenant and the currently backed up objects in the last 7 weeks. In the upper-right corner of each data source tile, you can view the total protected data size.
NOTEThe protected data size cannot be retrieved if the customer only has a trial subscription for Cloud Backup for Microsoft 365.
-
Discovery and Optimization
The Discovery & optimization tab displays the discovery and analysis results of the tenant, including Data summary, Inactive data, ROT data, Optimized data overview, and Optimization progress sections.
In the upper-right corner of this tab, there are two links.
-
Click the Workspace with inactive data link to access the Workspaces page of the SharePoint data source selected, displaying all sites where inactive data size is greater than 0 MB.
-
Click the Workspace with ROT data link to access the Workspaces page of the SharePoint data source selected, displaying all sites where ROT data size is greater than 0 MB.
Data summary and Inactive data sections.
ROT data and Optimized data overview sections.
Optimization progress section.
-
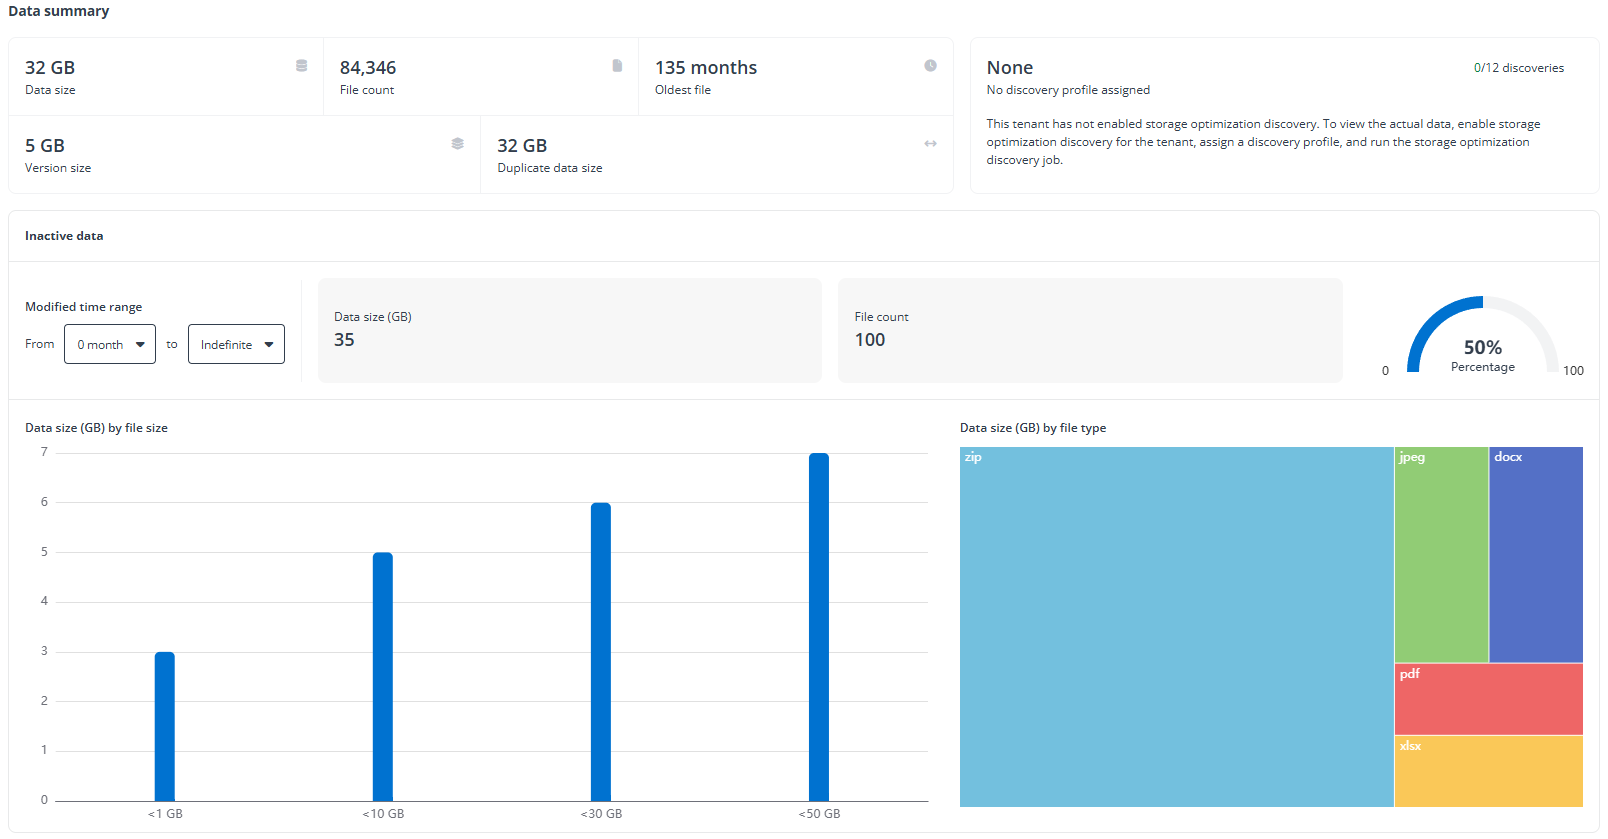
In the Data summary section, you can view the total data size, the total number of files, the age of the oldest file, the total size of files’ previous versions, and the total size of duplicate files within the tenant. Files in the same data source with the same name including file extension and size are calculated as duplicate files. In the right pane, you can view the applied discovery profile (if any) and the consumption of discoveries for the tenant.
-
In the Inactive data section, you need to set a time range to view inactive data. Files whose last modified time falls in the configured time range will be reported, including data size, file content, and the percentage of the inactive data size to the total data size. Click View details to access the Workspaces page where the sites with inactive data size greater than 0 MB are listed in the table. Switch to the OneDrive data source to view OneDrives with inactive data size greater than 0 MB.
-
Data size (GB) by file size – Displays the data size of files whose size is < 1 MB, >= 1 MB, or < 50 MB.
-
Data size (GB) by file type – Displays the data size of files by file type. It includes up to 20 file types.
-
-
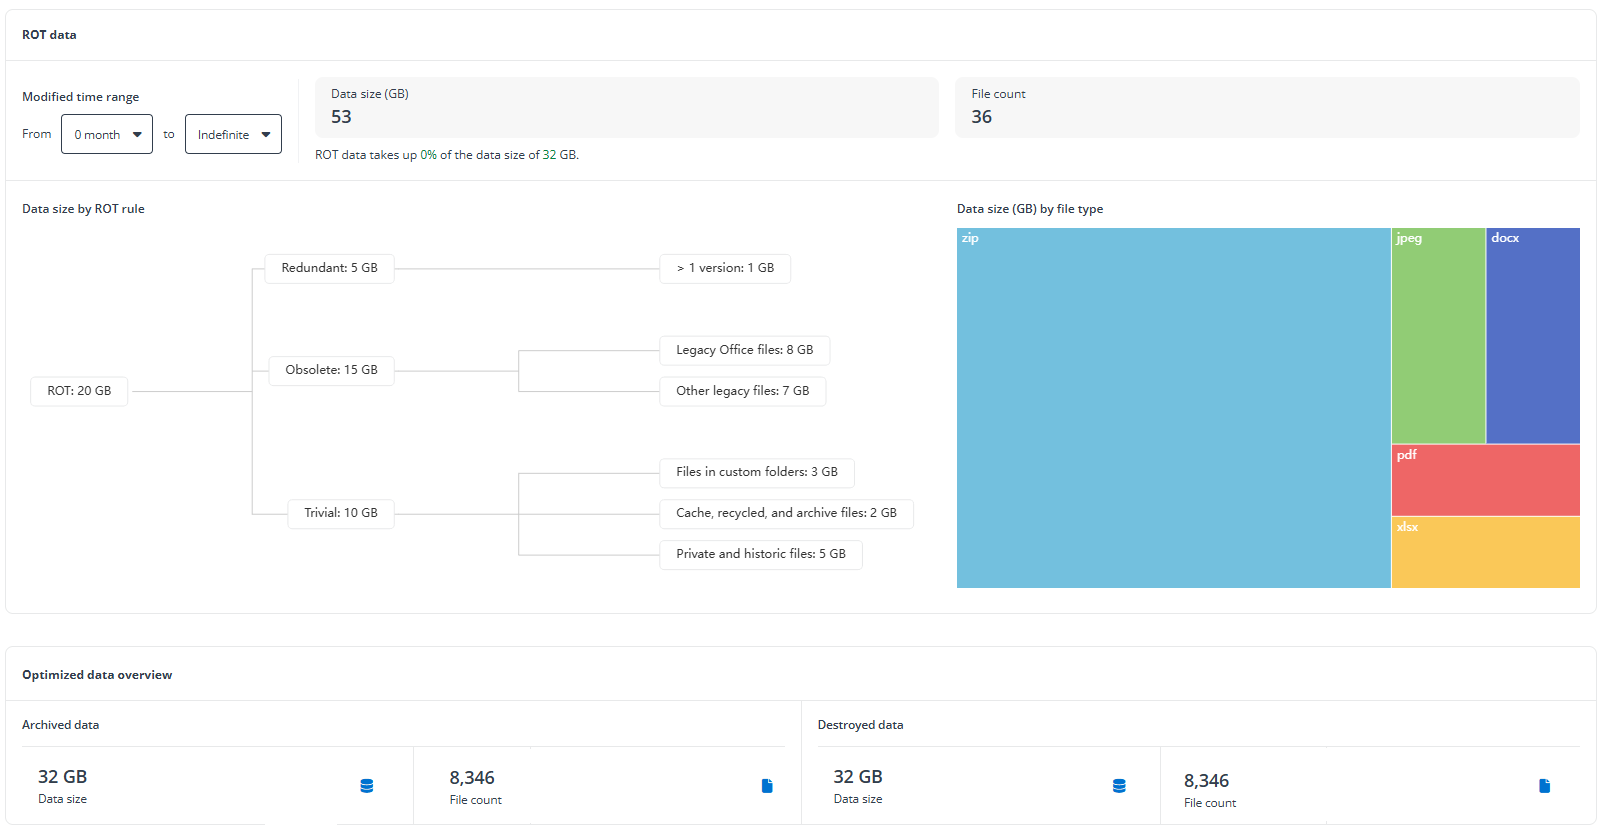
In the ROT data section, you need to set a time range to view ROT data. Files whose last modified time falls in the configured time range will be reported, including data size, file content, and the percentage of the ROT data size to the total data size. Click View details to access the Workspaces page where the sites with ROT data size greater than 0 MB are listed in the table. Switch to the OneDrive data source to view OneDrives with ROT data size greater than 0 MB.
-
Data size by ROT rule – Displays the data size in each ROT rule.
-
Data size (GB) by file type – Displays the data size of files by file type. It includes up to 20 file types.
-
-
In the Optimized data overview section, you can view the size and file count of archived data, and the size and file count of destroyed data.
-
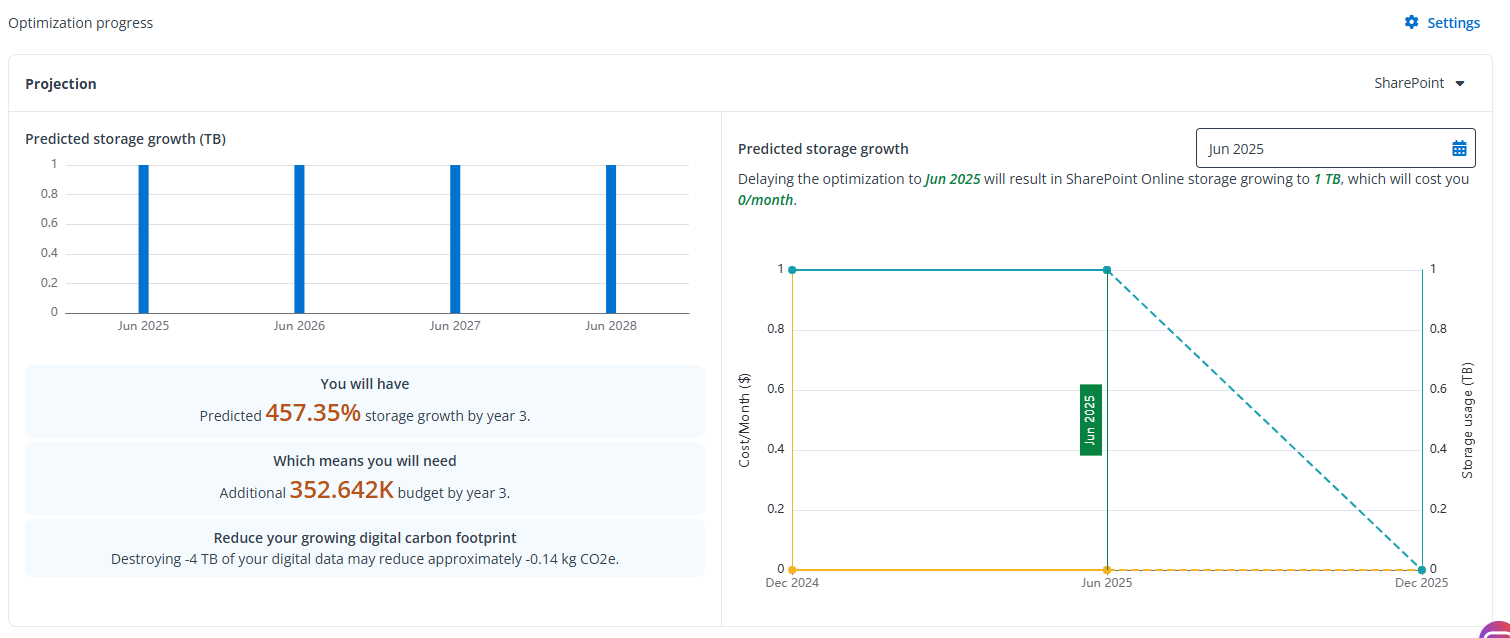
In the Optimization progress section, the predicted storage growth rate for over next 3 years, the storage budget you’ll need to pay over the next 3 years, and the digit carbon footprint that you can reduce by destroying the digital data. Besides, for a given month, you can find how much storage space will be taken up and how much you’ll need to pay for storage each month. Therefore, optimizing your data as soon as possible will save you a lot. Click Settings in the upper-right corner to configure settings.
-
Estimated optimization speed – Via the analyzed data size, Elements will calculate your data optimization speed (GB/Day). If this number needs to be updated, you need to contact AvePoint Technical Support for assistance.
-
Estimated SharePoint storage growth speed – Via the storage report in your Microsoft 365, Elements will calculate your storage growth speed (GB/Month). You can also enter a number to reflect the actual storage growth speed (GB/Month).
-
Estimated OneDrive storage growth speed – Via the storage report in your Microsoft 365, Elements will calculate your storage growth speed (GB/Month). You can also enter a number to reflect the actual storage growth speed (GB/Month).
-
Data size unit – Select a data size unit, either GB or TB.
You can switch the data source via drop-down options in the upper-right corner.
-