Home > tyGraph Web Part > tyGraph Pages Web Parts URL Parameter Listing > Enabling Debugging in the tyGraph Pages Engine
Download this articleEnabling Debugging in the tyGraph Pages Engine
At times, tyGraph support may ask that you turn on debugging in the tyGraph Pages Engine to troubleshoot an issue. Debugging can be enabled by appending the query string parameters ?tyGraphDebug=true to any SharePoint page. If your page already has query string parameters replace "?" with "&".

Viewing Debug Information
Follow these steps to view the debug information in the browser's developer console. Support may ask you to provide them with a copy of this information or screenshots.

-
In Google Chrome or Chrome-based versions of Microsoft Edge, click the (…) button in the top-right corner.
-
Click More Tools and click Developer Tools.
-
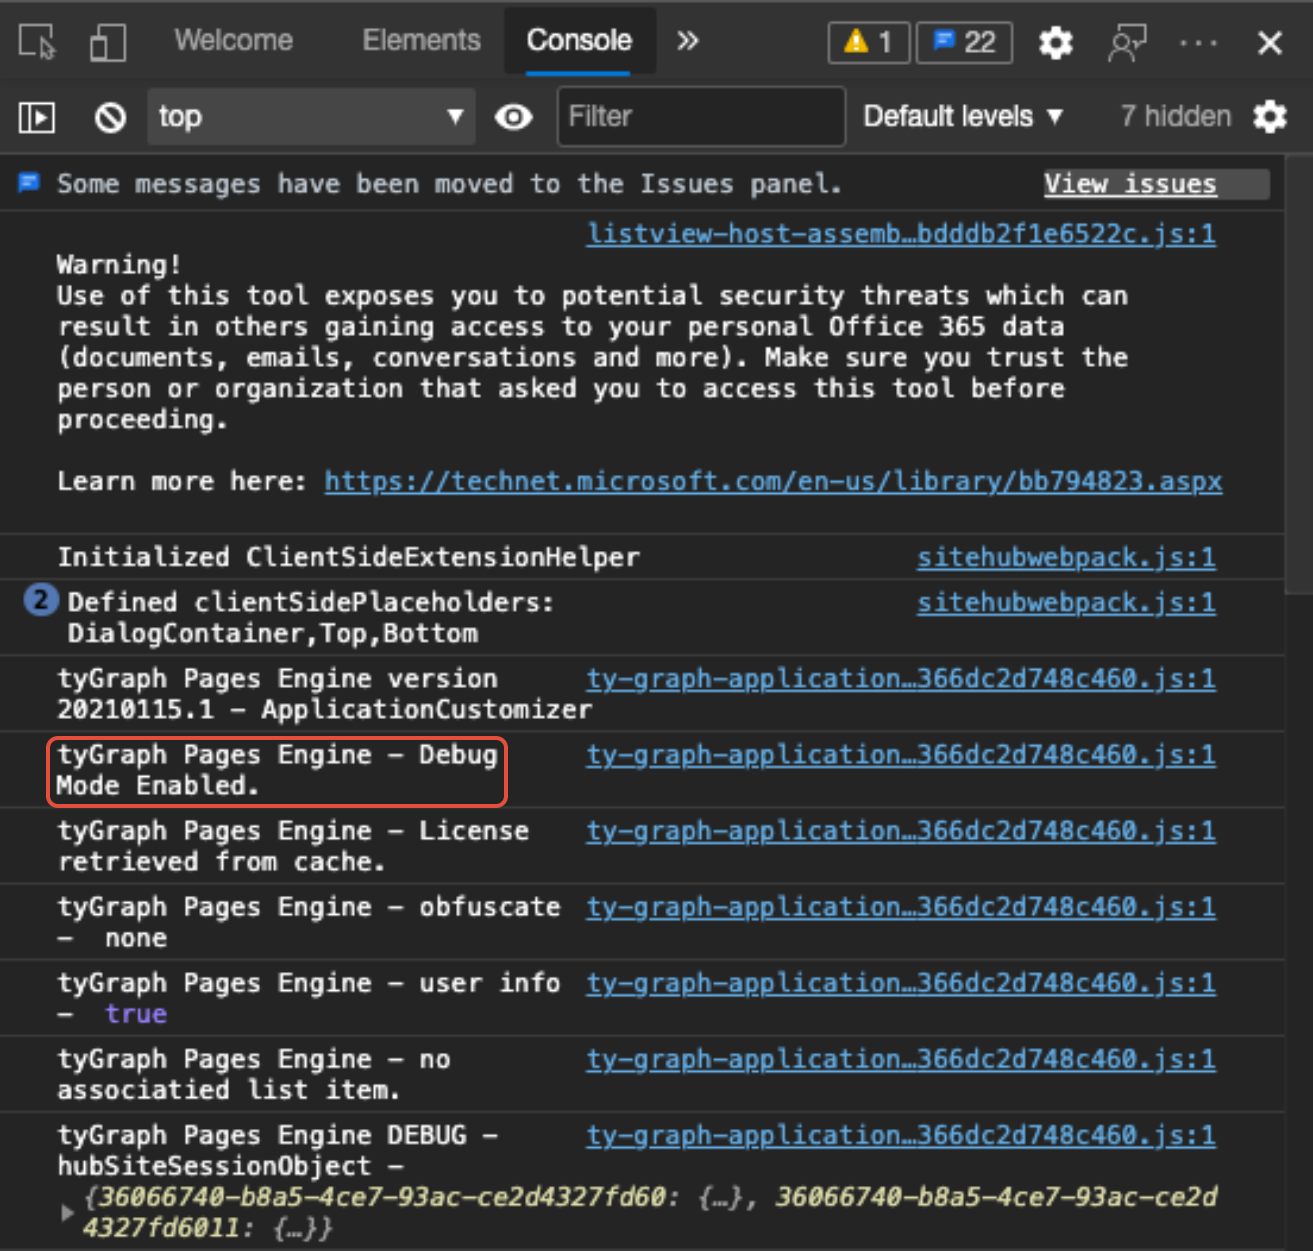
Click the Console tab.
-
Look for the text "tyGraph Pages Engine – Debug Mode Enabled".
Exporting Network Diagnostics
A representative from tyGraph Support may request that you send a network trace from the browser by exporting a HAR file.
-
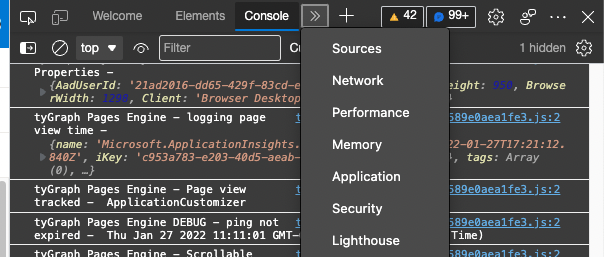
In the browser's Developer Tools as shown above, click the (>>) icon to find the Network menu option to show that tab.

-
Click the Down arrow icon and save the file to disk.

-
Send the file to tyGraph Support as directed.