
Dashboard
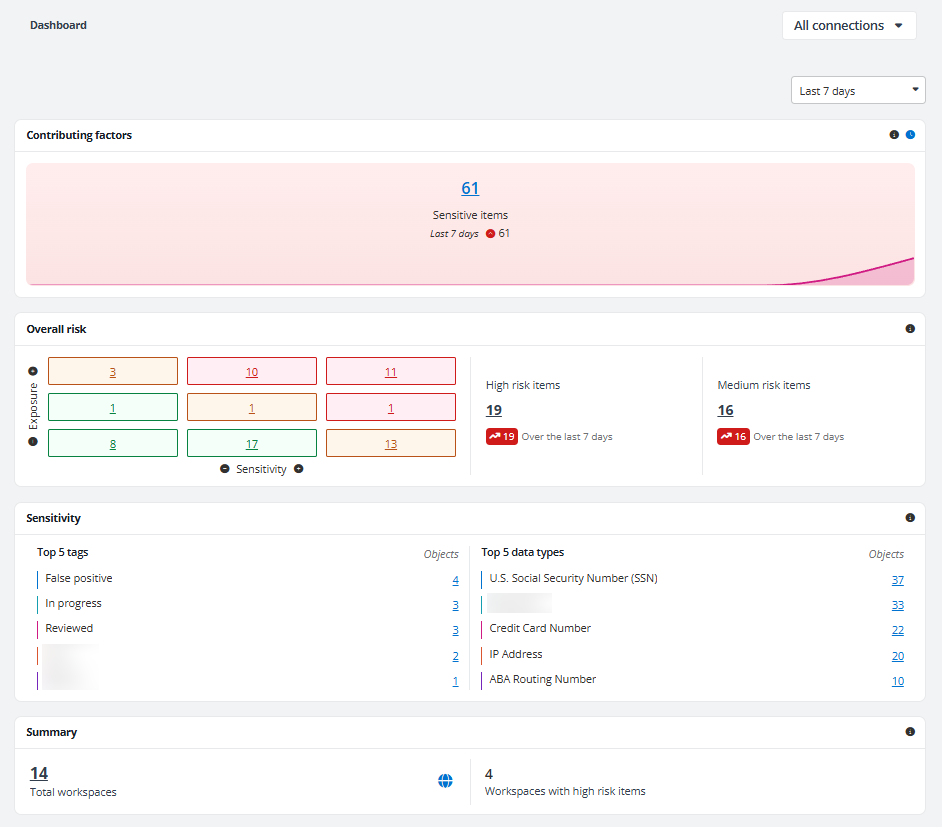
After connections are configured and risk definition profiles are applied, you can view Insights data on the dashboard. In the upper-right corner of the dashboard, you can select All connections or a specific connection to define the dashboard data scope. You can also select a date range to view statistics for the last 7 days, 3 months, or 6 months.
Contributing factors
On the top of the dashboard page, you can view the Contributing factors section.
The chart displays trends in sensitive items in the configured data scope in the selected date range.
Hover over a data point to view the number of sensitive items for that day or month. You can also view the change in the number of items for the selected date range above the chart.
Click the sensitive items count link to access the Risk analysis > Detailed records page.
Overall risk
The Overall risk section shows the calculated risk using the configured exposure and sensitivity definitions.
You can view a matrix that contains nine cells in three colors. Hover your mouse over a cell, and the exposure and sensitivity levels are displayed. You can also view the number of items that match the exposure and sensitivity definitions.
To the right of the matrix, you can view High risk items and Medium risk items. You can view the number of records with high/medium risk of the day or month. The changes in numbers for the last 7 days, last 3 months, or last 6 months can also be found below. Good Job! is shown if no risk items are discovered in the data scope. Click the number link to access the Risk analysis > Detailed records report page of the high/medium risk items.
The table below illustrates the risk level calculation based on sensitivity level and exposure level:
| Exposure level \ Sensitivity level | High | Medium | Low | Not sensitive |
|---|---|---|---|---|
| High | High Risk | High Risk | Medium Risk | No risk |
| Medium | High Risk | Medium Risk | Low Risk | No risk |
| Low | Medium Risk | Low Risk | Low Risk | No risk |
Sensitivity
In the Sensitivity section, the following components can be viewed.
-
Top 5 tags – The top five tags and the number of objects to which those tags are applied are displayed. Click a number link to go the Risk analysis > Detailed records page where objects with the corresponding tag are listed.
-
Top 5 data types – The top five data types and the number of matching objects are displayed. Click a number link to go to the Risk analysis > Detailed records page where objects matching the corresponding data type are listed.
Summary
In the Summary section, you can view the total number of workspaces in All connections or the currently selected connection. Click the number link to access the Workspaces page where all workspaces are listed.
You can also view the number of workspaces where there are high risk items.